| INDEX | LEVEL 31 AUGUSTT | LEVEL 31 SEPTEMBER | CHANGE |
| S&P 500 | 3955 | 3586 | -9.21% |
| FTSE 100 | 7284 | 6908 | -5.2% |
| Euro Stoxx 600 | 415 | 387 | -6.74% |
| Shanghai | 3227 | 3024 | -6.3% |
| US 10 Yr Treasury Yield | 3.13% | 3.8% | +0.67 |
| UK 10 Yr Gilt Yield | 2.78% | 4.08% | +1.3 |
| Bund 10 Yr | 1.53% | 2.1% | +0.48 |
September was another difficult month for both equity and bond markets, with declines across both asset classes. Indeed, the moves meant we saw the first 3 consecutive quarters in declines for both the US equity market (S&P 500) and bonds (Bloomberg Aggregate bond market) since records began in 1976.
UK bond investors were particularly impacted by the market’s reaction to the new Chancellor’s apparently unfunded tax cuts, which is evidenced by the increase in UK ten-year Gilt yields in the table above. This significant increase was seen as a vote of no confidence in the government’s economic policies by the markets and caused disruption to both pension funds and the mortgage market. The moves were of such a scale as to prompt intervention by the Bank of England, which resorted to buying long dated gilts in order to stabilise the market, having only recently indicated that they would be decreasing their holdings as part of their efforts to combat near double digit inflation.
This action reflected many commentators fear that decreasing taxes at a time when the Bank was attempting to reduce demand through higher interest rates, flew in the face of the Bank’s own monetary policy.
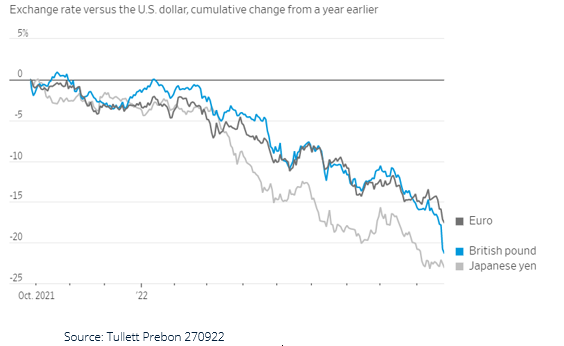
However, there was some comfort gained for UK investors as the declining pound, which was attributed to the government’s actions, dampened the effect of falls in overseas markets. It should be pointed out, without condoning the policies, that this is more of a case of a rampaging US dollar, as opposed to simply a declining pound, as the chart below demonstrates:

And looking beyond some of the more dramatic headlines, the charts below demonstrate the UK’s relative position isn’t necessarily as bad as those headlines indicate.

The left-hand chart demonstrates the percentage of government debt in relation to GDP against the other members of the G7, with the red diamond showing the UK position post the tax cuts. The right-hand one demonstrates that the UK has a longer time-frame over which to pay it back. So, perhaps the UK’s situation is not as bleak as it first appears.
Notwithstanding the UK’s individual woes, the key driver for market performance is still the high levels of underlying inflation and consequent central bank policy in relation to this. This is particularly notable in the US where the Federal Reserve continued to assert that their job with regards to subduing inflation is far from over and we saw expectations for the peak in interest rates to increase to between 4.5 to 4.75 percent (source FedWatch 021022).
Given the US is the world’ largest stock market, investors pay particular attention to what the ‘Fed’ is saying and partly explains why we saw the US market decline so much in September. However, one indicator the Fed have said they would like to see weakening as a part of their interest rate decision making process, is employment, which has remained stubbornly high. However, there are early signs that this situation may be changing, so investors will be alert to this.
Elsewhere, in Europe the UK and European inflation picture continues to be somewhat unpredictable given the impact Russia continues to have on energy prices and thus the prospects for economic growth. Here, stagflation (low or negative growth with high inflation) continues to be a real possibility, given energy prices are largely out of central banks’ control. Something also out of the Bank of England and the ECB’s control is the strength of the US dollar which, given that most commodities are priced in dollars, means that non-dollar based economies are effectively importing inflation. This leaves little room for visibility in European equity markets at present.
Japan, having allowed its currency to weaken significantly against the US dollar started to attempt the process of strengthening the Yen, which something that we may see talked about more often in other G7 economies.
China, whose stock market in recent months has surprised on the upside, succumbed to low economic growth forecasts as a result of both COVID restrictions and the continued financial fallout from the downturn in the property market there. Some economic forecasts have China growing at a slower rate than it has historically and below that of its neighbouring emerging markets.
In terms of portfolio activity, managers are still holding higher than usual levels in cash, particularly in lower risk solutions. However, we have seen some deployment of this to buy overseas bonds in some solutions, which reflects a view that we may be nearing the peak in the interest rate cycle. Within the equity content, we have also seen a steady increase in the exposure to dividend weighted funds, given income paying stocks tend to perform well during periods of higher inflation. While the news flow from here will vary, particularly with earnings reporting season upon us, we are getting closer to the Fed’s ‘pivot point’ on interest rates, so our managers will be alert to signs of this in terms of deploying cash raised. With this in mind, and the fact that the S&P 500 has already retreated 25% from its peak, are we getting nearer to the point where the longer term investor could soon start to be rewarded for their patience during these trying times?
.webp)

